Skip to content

// read-only · local · single binary

cc‑analyzer_

Point it at the JSONL transcripts already sitting in ~/.claude and it reconstructs the ledger your Claude Code sessions never wrote down — cost, tokens, cache accounting, tools, skills, models, per-turn breakdowns, and actionable context diagnostics.

$ curl -fsSL https://cc-analyzer.brnby.com/install.sh | sh

macOS / Linux · detects platform · verifies SHA-256 · review installer

$ cc-analyzer --modules6 loaded · all local
[01]

Cost accounting that suggests a next step

Sessions record token counts, not cost. cc-analyzer prices every category, then flags context pressure, cache rewrites after idle gaps, weak compaction recovery, and concentrated turn spend with the evidence behind each suggestion.

[02]

Interactive terminal UI

An amber-phosphor Ink TUI: a persistent nav rail and two-pane master-detail where the list drives a live preview, plus a full-screen session view with turns → steps, charts, transcript, and an evidence-backed diagnostic summary.

[03]

Local web app

cc-analyzer serve launches a Hono API and an embedded React dashboard: portfolio overview, project drill-down, a windowed transcript reader, and the same actionable session diagnostics as the CLI and TUI.

[04]

Incremental SQLite index

A disposable local index that re-parses only changed sessions (by size + mtime), then powers portfolio-wide analytics — spend by month, project, and model.

[05]

Single-binary distribution

Ships as one self-contained executable — CLI, TUI, API, and web UI baked in — cross-compiled for macOS, Linux, and Windows.

[06]

Read-only health checks & privacy

cc-analyzer doctor checks parser integrity, conversation links, tool results, and interrupted prompts without touching the source. Normal analysis is local; the optional Claude handoff is explained in the privacy guide.
// interactive terminal UI

The real TUI, frame for frame

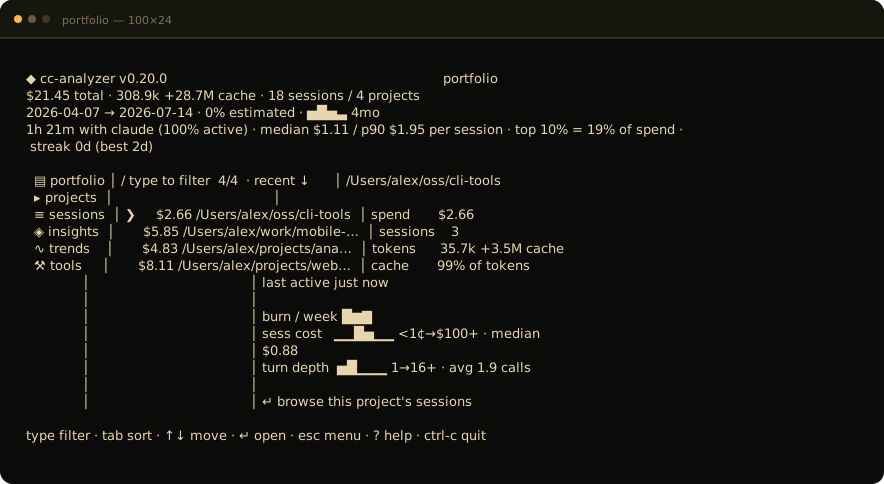
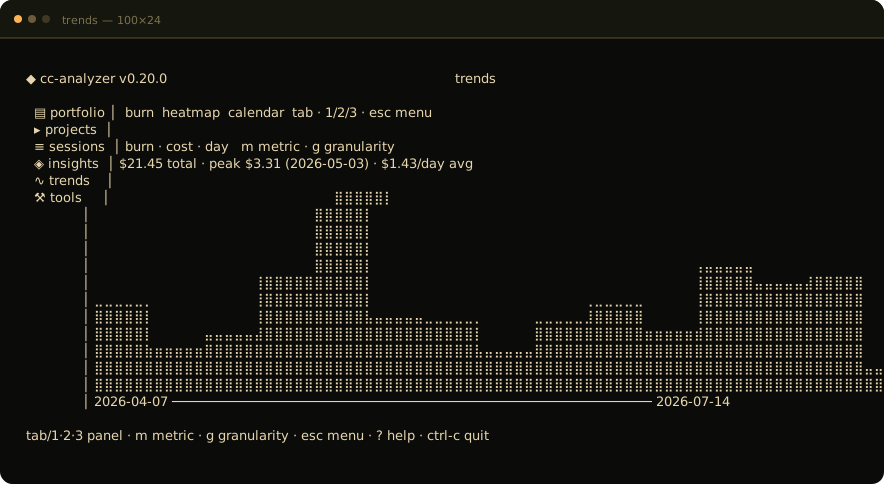
Generated from the Ink application against the same synthetic fixture as the dashboard. Portfolio and Trends are shown here at 100×24.

cc-analyzer TUI portfolio screen generated from the real Ink application
01 Portfolio — totals, projects, and live preview
cc-analyzer TUI trends screen generated from the real Ink application
02 Trends — burn chart and activity heatmap

// local web dashboard

Your session ledger, made visible

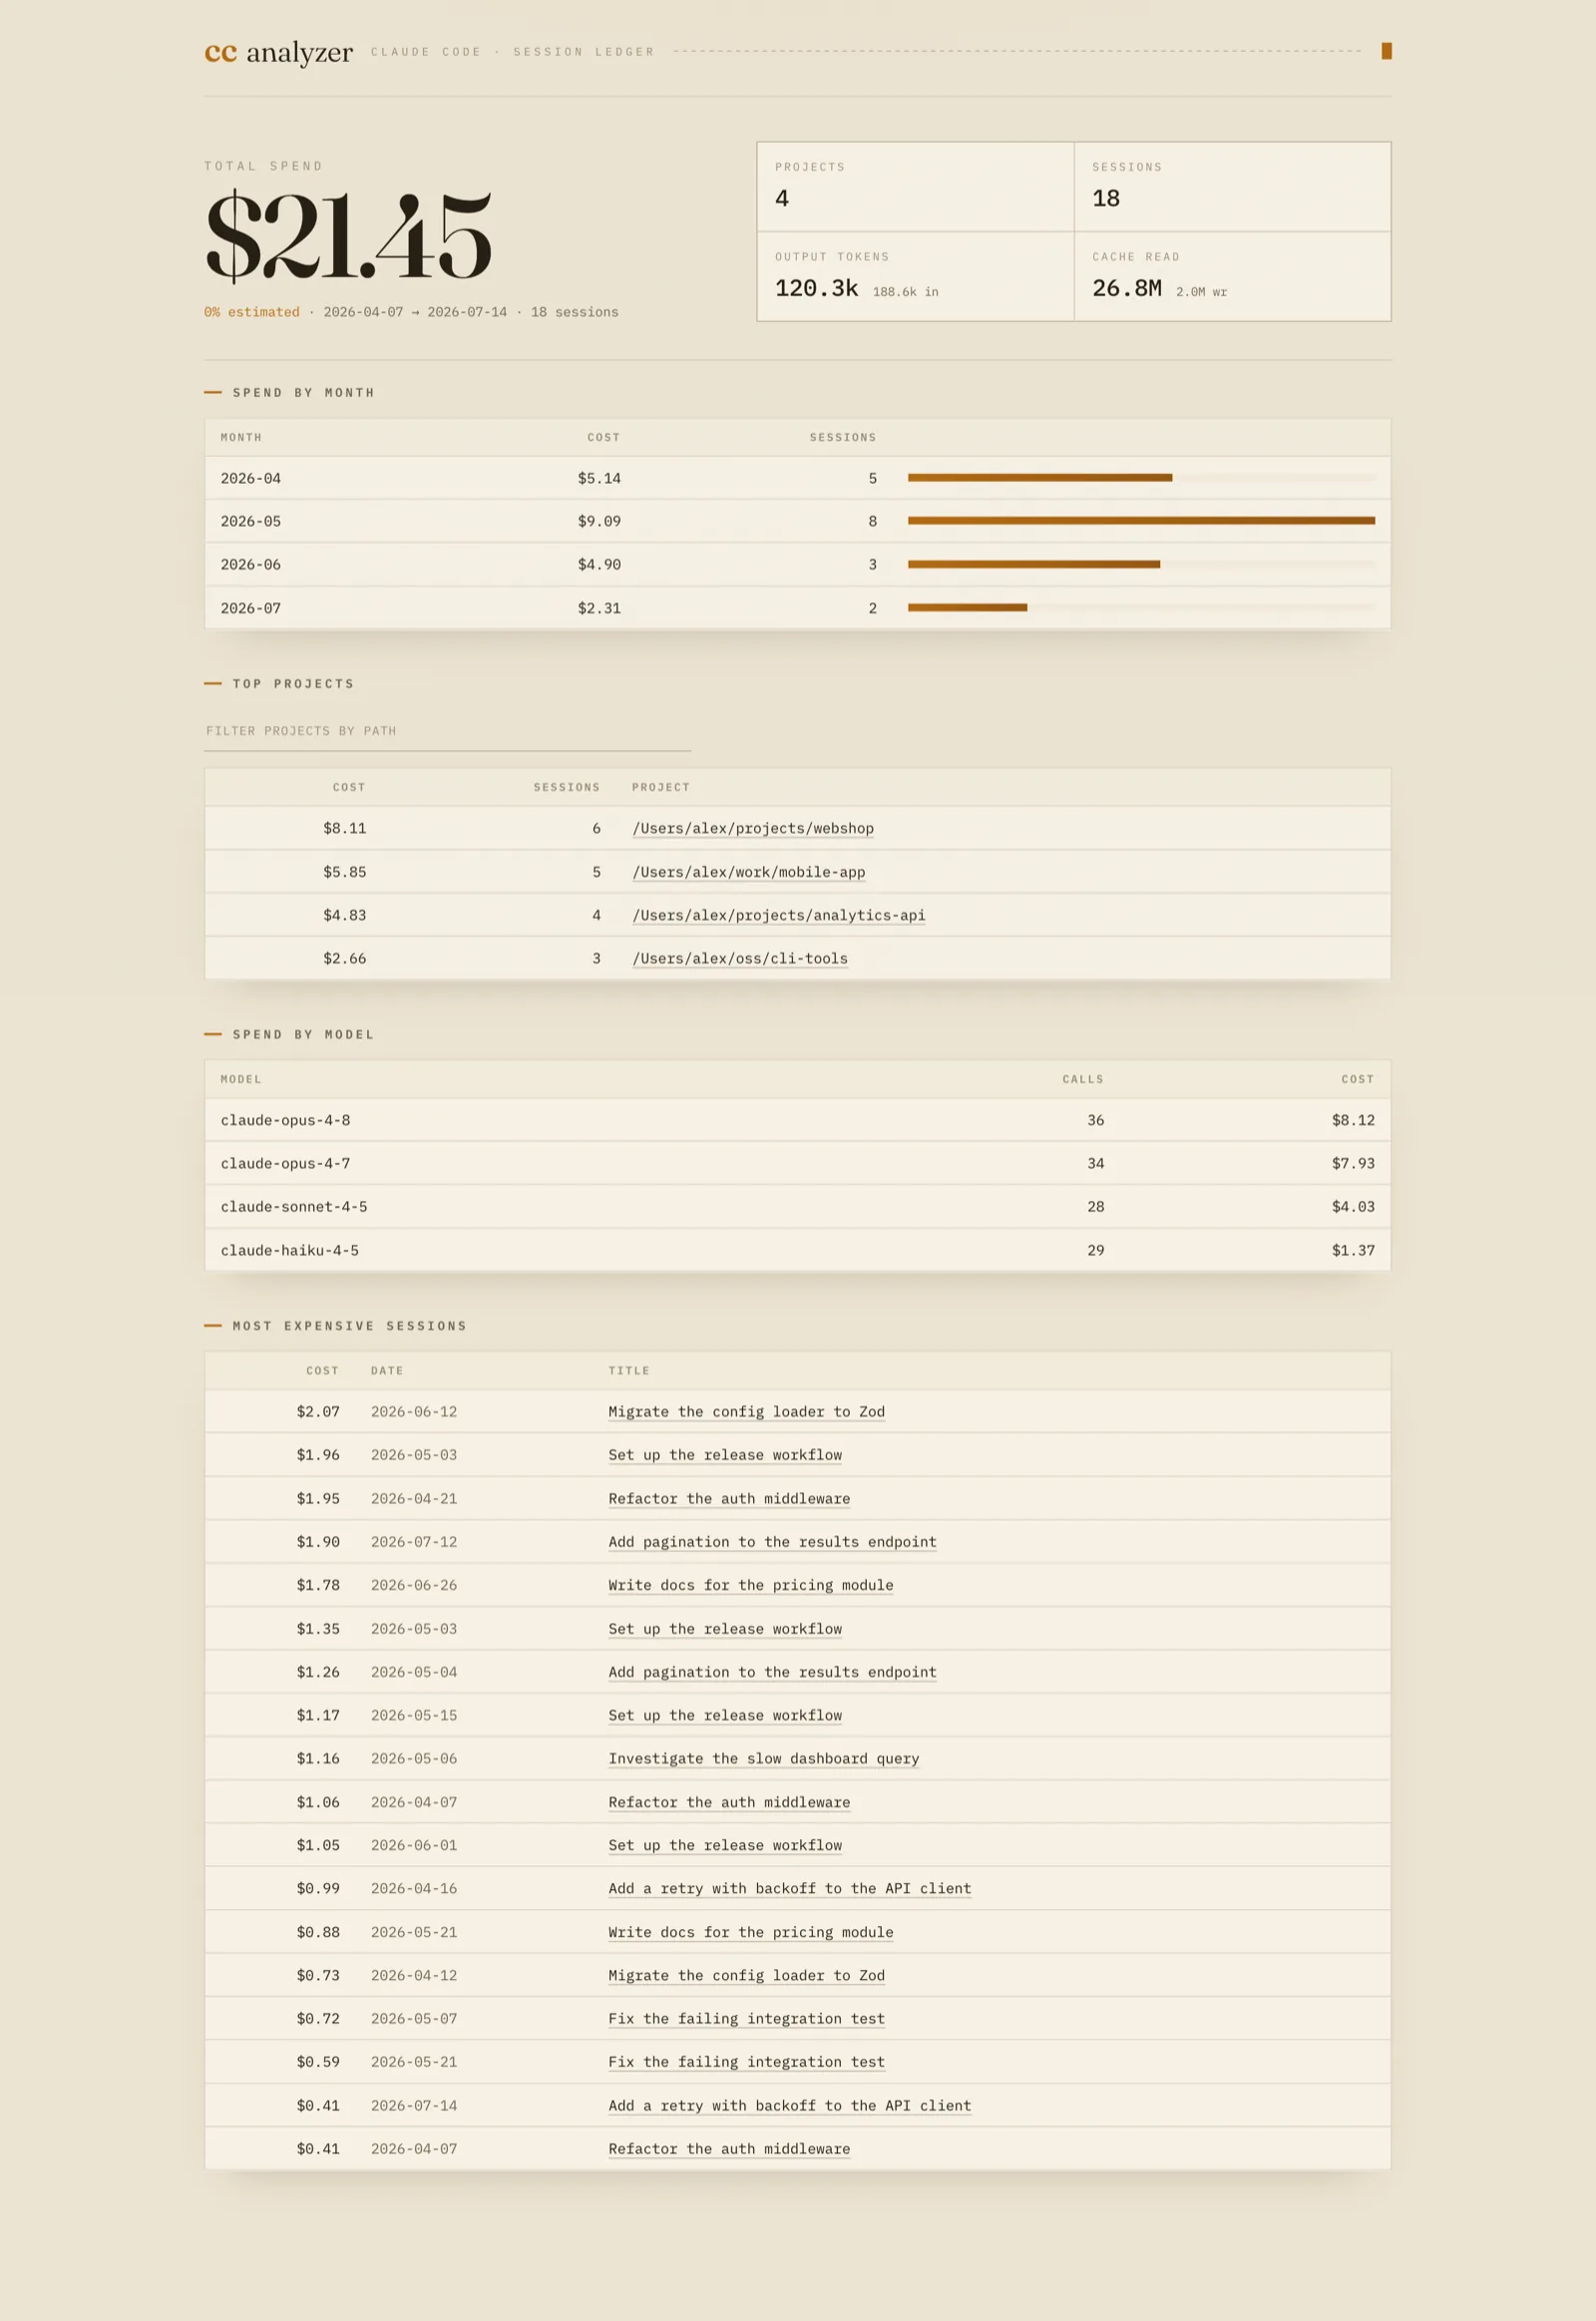
Launch cc-analyzer serve to explore portfolio totals, projects, trends, tools, and individual sessions in a dashboard served entirely from the local binary.

Preview data is synthetic. Normal analysis stays local; optional Claude handoff processing is described in the privacy guide.

cc-analyzer web dashboard showing synthetic portfolio totals, charts, and project activity
Open the full dashboard preview ↗

// quick start

From zero to ledger
in three commands

Every release ships a self-contained binary for macOS, Linux, and Windows — or run it from source with bun. The index is a disposable local cache; delete and rebuild it any time.

Full install guide ▸
quick-start.sh
# 1 · install — one line; detects your platform, grabs the latest binary
curl -fsSL https://cc-analyzer.brnby.com/install.sh | sh
#   (Windows PowerShell one-liner in the install guide ▸)
 
# 2 · build the index from ~/.claude, then read the totals
cc-analyzer index
cc-analyzer stats
  $21.45 total spend   ·   18 sessions   ·   4 projects
 
# 3 · dig in — one session, the TUI, or the local web app
cc-analyzer analyze <session-id> --json
cc-analyzer            # interactive terminal UI
cc-analyzer serve      # http://localhost:4317

  read-only over Claude transcripts  ·  local by default  ·  optional Claude handoff is disclosed in Privacy & security